Optimal Haul Export Contents
The Optimal Haul export is spreadsheet compatible (Clipboard or CSV file) and contains earthwork volumes and movements by material. For more information on how to export this data see Optimal Haul Export Options.
Summary section
The first few rows of the spreadsheet contain summary information. This is slightly more detailed than the information area of the alignment panel.
Cost Summary
The column contents are as follows:
-
Earth Movement: haul cost by material.
-
Cut: Excavation cost (including pits).
-
-
Site Preparation: is the sum for all opened pits (material is not applicable).
Volume Summary
This table reports volumes for all material sources (positive) and uses or disposal (negative). The sum of volumes for each of the materials is zero; this indicates conservation of mass.
The column contents are as follows:
-
Cut: excavation from the road-bed.
-
Borrow: material from a user defined pit.
-
Underflow: material from the system defined pit of last resort.
-
Fill: embankment in the road-bed.
-
Waste: disposal to a user defined pit.
-
Overflow: disposal to a system defined pit of last resort.
-
Sidecast: disposal along the road corridor directly opposite the excavation (not a pit).
Pit Summary
This table contains total volumes of material extracted from pits (positive) and deposited into pits (negative). In addition, the pit location (Station) and access road deadhaul (Distance) are included. Details of pit movement are available below.
Movement Summary
This table reports total volumes of material moved. Rather than define all possible movement types (pit to road, road to road, road to sidecast, etc.) we define load (positive) and unload (negative). Material is handled by earthmoving equipment; the equipment loads material, moves it somewhere, and unloads it.
Again, the sum of each of the rows is zero.
The column contents are as follows:
-
Station Load: material from the road-bed loaded onto a conveyor.
-
Pit Load: material from a user or system defined pit loaded onto a conveyor.
-
Station Unload: material from a conveyor unloaded to the road-bed.
-
Pit Unload: material from a conveyor unloaded to user or system defined pit.
-
Same Station Unload (no movement): material from a conveyor unloaded to the road-bed.
-
Sidecast (no movement): material from a conveyor unloaded directly opposite the excavation (not a pit).
Details section
A movement model
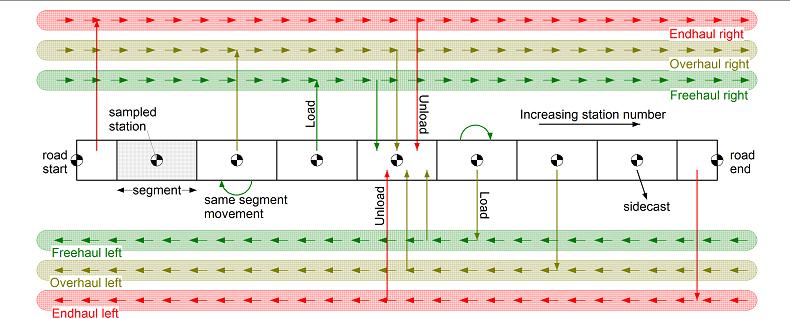
The rest of the output (and the largest part) contains the detailed movement information. In order to understand this section (and the movement summary above), consider material movement as a series of six conveyor belts which move material forwards and backwards as below:
Detailed movement
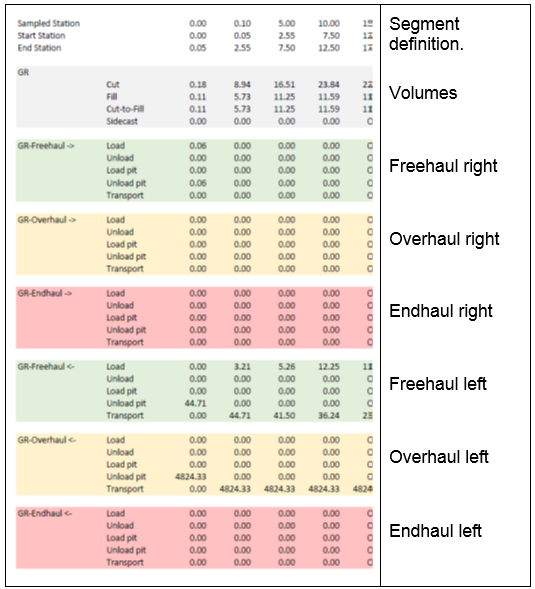
The movement details section contains all the data required to draw the Optimal Haul graphic.
The first rows define the segments by station range.
The next block of rows contains the volumes by segment for the first material:
-
Cut: volume of material excavated from the road-bed.
-
Fill: volume of material used in construction of the road-bed.
-
Cut-to-Fill: volume of Fill the comes from cut in the same segment (zero movement).
-
Sidecast: volume of Cut disposed of along the road corridor directly opposite the excavation (zero movement).
Then we have the six conveyors for the first material. Each conveyor has the following entries:
-
Load: material from the road-bed loaded onto this conveyor.
-
Unload: material from this conveyor unloaded to the road-bed.
-
Load Pit: material from a pit loaded onto this conveyor (pit access station must be in the segment).
-
Unload Pit: material from this conveyor unloaded to a pit (pit access station must be in the segment).
-
Transport: material from this segment moving to the next segment (right -> or left <- depending on conveyor).
Detailed pits
Unlike the pits summary, this tells you which of the six conveyors was loaded from a pit (positive) or unloaded to a pit (negative).